

How to Debug GTM Tags Across Analytics and Marketing Platforms
An overview of GTM tag debugging tools used to validate analytics, marketing platforms, consent behavior, and server-side tracking.

Napkyn
Debugging analytics and marketing tags is rarely limited to a single platform. In most modern setups, Google Tag Manager functions as the execution layer for analytics tools, advertising pixels, consent signals, and increasingly, server-side tracking.
Validating these implementations requires more than confirming that a tag fires. Teams must verify that requests are sent at the correct time, include the correct parameters, respect consent conditions, and ultimately deliver accurate data to the intended platforms. This applies across analytics tools, paid media platforms, and supporting infrastructure such as browser storage and server-side endpoints.
To support this work, a wide range of browser extensions and developer tools have emerged. These tools surface data layers, network requests, consent states, and payload details that would otherwise require manual inspection.
Tag debugging refers to the process of validating that analytics and marketing tags fire correctly, send accurate data, respect consent conditions, and deliver payloads to the correct platforms.
This article outlines the debugging tools commonly used to validate GTM-based implementations across analytics and marketing platforms, and explains how each fits into a practical QA and troubleshooting workflow.
#1 Analytics Debugger (GTM and Multi-Platform Tag Debugging)

Author: David Vallejo
Where to find it: Chrome Web Store, Analytics Debugger
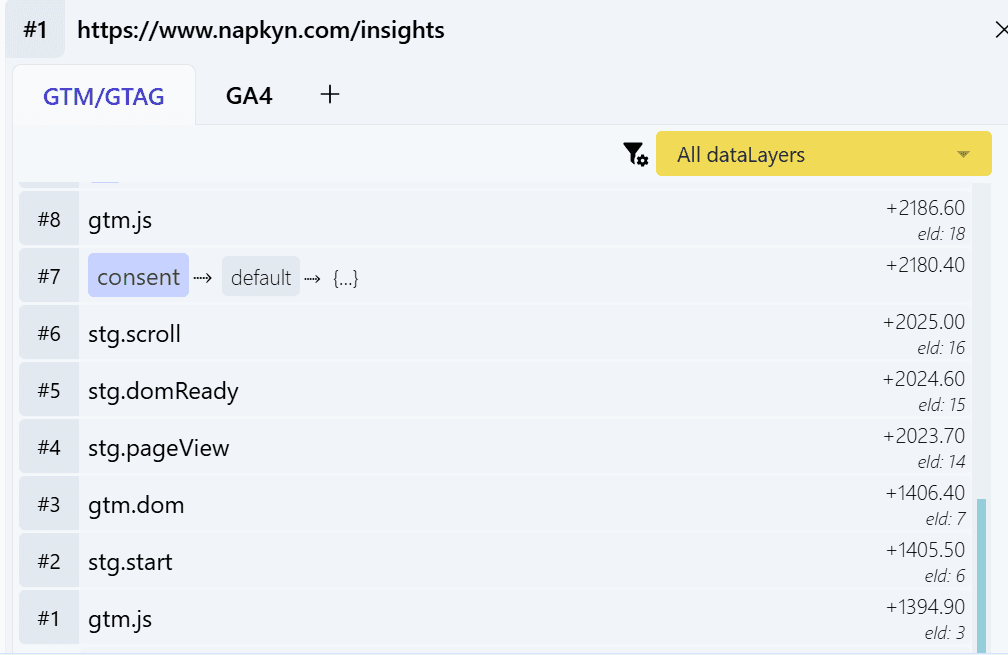
Analytics Debugger is a primary tool for inspecting analytics implementations. While it originally focused on GTM and Google Analytics, it has expanded to support platforms such as Adobe Analytics, Matomo, Piwik Pro, and Tealium.
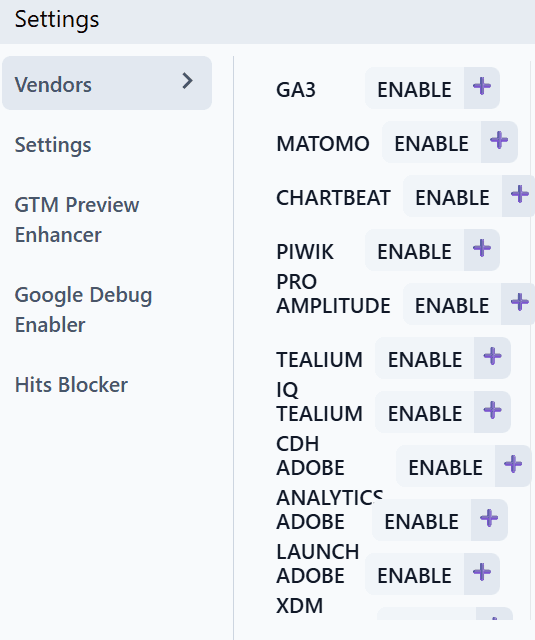
One of its core strengths is how clearly it exposes the Data Layer on a page, whether that is dataLayer for GTM or utag.data for Tealium. It also detects tag manager containers, analytics tracking IDs, consent mode statuses, and can trigger GA4 Debug Mode.
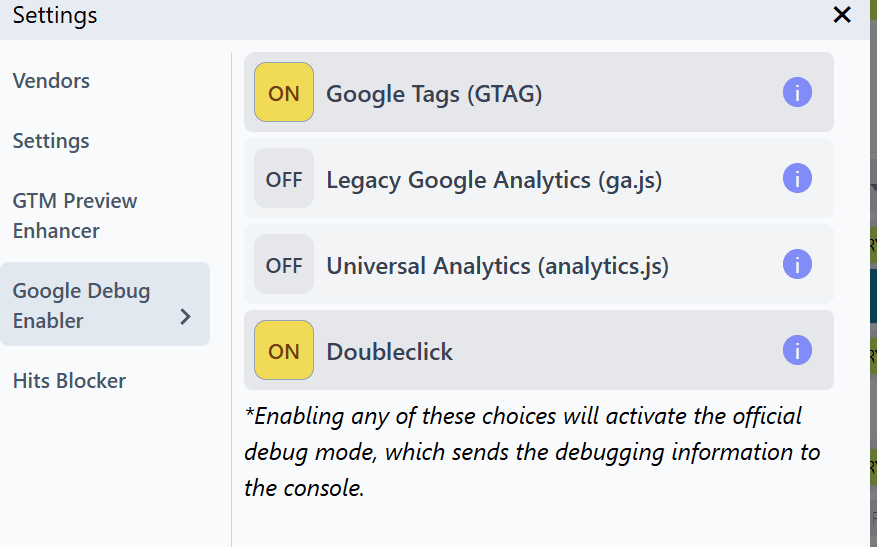
In addition, it surfaces raw request details and underlying technical payloads. This level of visibility makes it easier to understand what data is leaving the browser and how it is structured. An app version of the extension is also available.
#2 Tealium Tools (Tealium Implementation Debugging)
Author: Tealium.com
Where to find it: Chrome Web Store, Tealium Tools
When working with Tealium implementations, this extension is a core part of the debugging workflow. It provides visibility into tracking activity, hit delivery, and environment switching.
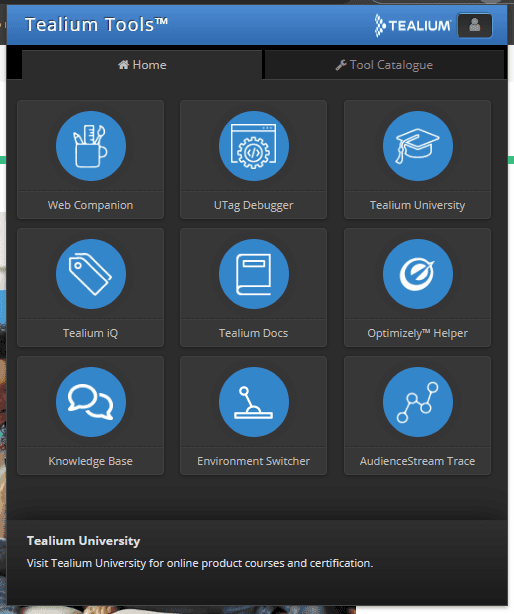
The tool is particularly useful when validating variables, events, and environment-specific behavior in real time. It removes much of the guesswork involved in understanding what is happening behind the scenes during execution.
#3 Stape GTM Helper (Server-Side GTM Debugging)
Author: Stape.io
Where to find it: Chrome Web Store, Stape GTM Helper
Stape GTM Helper enhances the standard GTM preview experience, with a strong focus on server-side GTM implementations.
Notable features include:
JSON syntax formatting
Cleaner formatting of request URL query parameters
Colour coding for tag types and tag statuses
Visibility into consent status within server-side GTM
These enhancements improve readability and interpretation when working with complex server-side setups, making GTM preview mode more efficient and easier to navigate.
#4 DataLayer Checker Plus (Data Layer Validation for Shopify and GTM)
Author: growthacademy.io
Where to find it: Chrome Web Store, DataLayer Checker Plus
This tool is commonly used to validate Shopify Data Layer implementations, especially in environments involving iFrames and modern pixel-based tracking.
It captures all messages pushed to the Data Layer, whether they occur on page load, through triggered events, or via manual pushes. The data is displayed directly within the extension, removing the need to inspect scripts manually.
Once installed, the extension works out of the box with the default GTM Data Layer. It also supports Shopify Customer Events. If a Data Layer is enabled through that feature, the “Shopify Custom Pixel DataLayer Checker” can be activated in the extension settings. If not, the default configuration still functions as expected.
#5 TikTok Pixel Helper (TikTok Tracking Validation)
Author: TikTok For Business
Where to find it: Chrome Web Store, TikTok Pixel Helper
TikTok Pixel Helper is used to confirm whether TikTok tracking is firing correctly and to review which events are being sent.
The tool highlights errors and warnings, making it especially useful when debugging custom implementations or server-side TikTok pixels. It provides a clear view of what is working and what requires adjustment.
#6 Meta Pixel Helper (Meta and Facebook Pixel Debugging)
Author: Meta (Facebook)
Where to find it: Chrome Web Store, Meta Pixel Helper
Meta Pixel Helper is essential for validating Facebook and Instagram tracking. It detects the Meta Pixel on a page, lists all triggered events, and flags warnings or errors such as missing parameters or incorrect event firing.
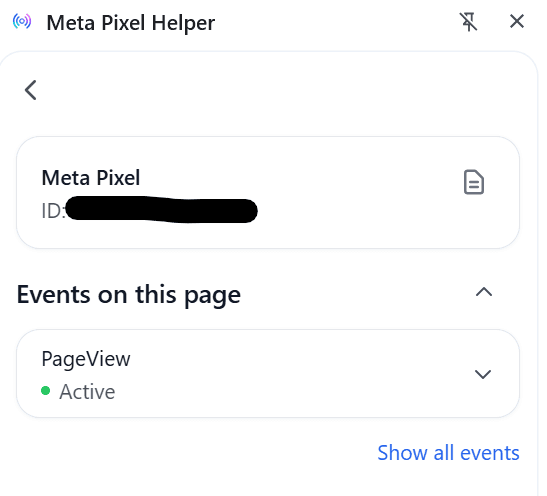
It is particularly useful during audits or when validating changes to Meta advertising implementations.
#7 Google Tag Assistant (Google Tag Validation)
Author: Google
Where to find it: Chrome Web Store, Tag Assistant
Tag Assistant is a long-standing tool for checking whether Google tags such as Google Analytics, Google Tag Manager, and Google Ads are firing correctly.
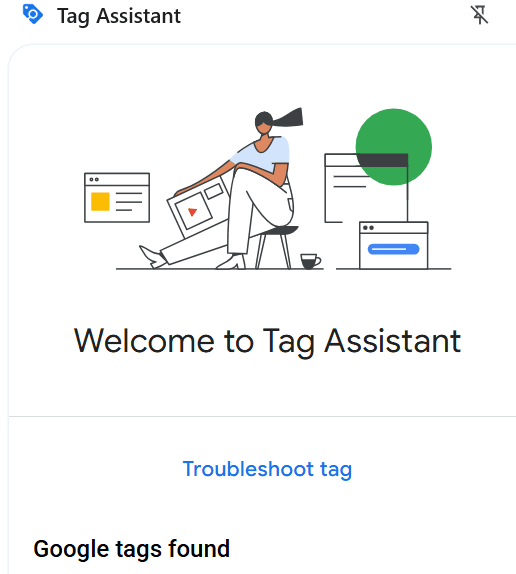
While it is less feature-rich than some newer tools, it remains useful for identifying issues such as duplicate tags, missing IDs, or basic configuration errors.
The extension integrates with tagassistant.google.com and allows users to activate debug mode through the “Troubleshoot” option. This enables deeper inspection of implementations, including activity within iframes, all within a single session that can be reviewed later.
#8 Omnibug (Network-Level Tag Inspection)
Author: Philip Lawrence
Where to find it: Chrome Web Store, Omnibug
Omnibug is a powerful tool for inspecting analytics and marketing tags at the network level. It decodes requests from platforms such as Adobe Analytics, GA4, Meta, TikTok, and others, presenting payloads in a human-readable format.
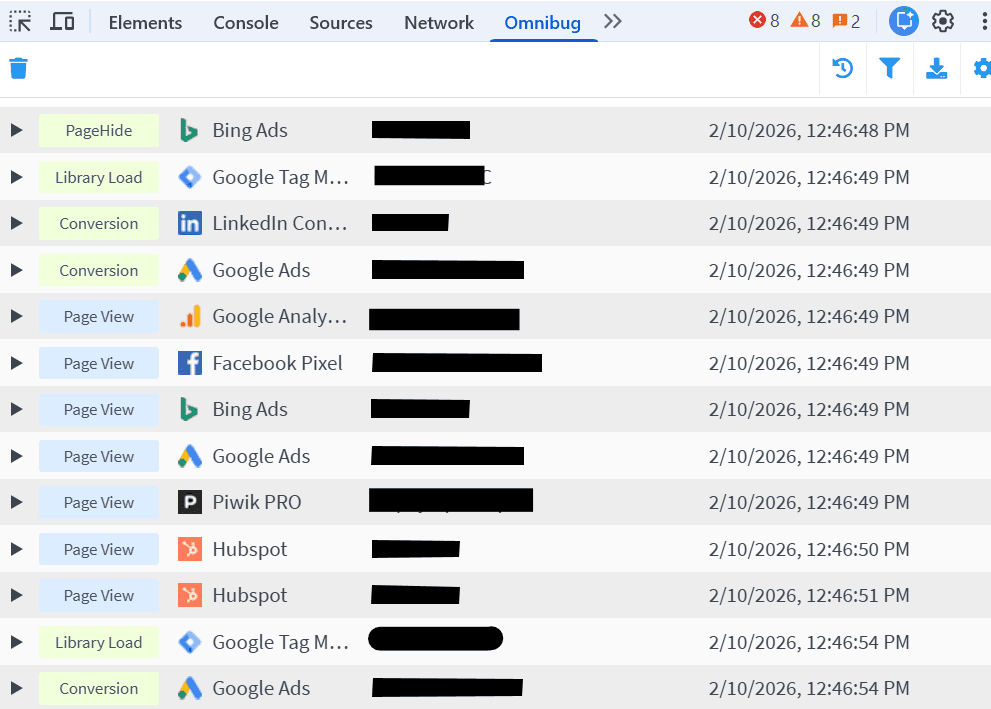
This is especially valuable when troubleshooting complex issues or comparing request structures across multiple platforms. It significantly reduces the time required to understand what data is being sent.
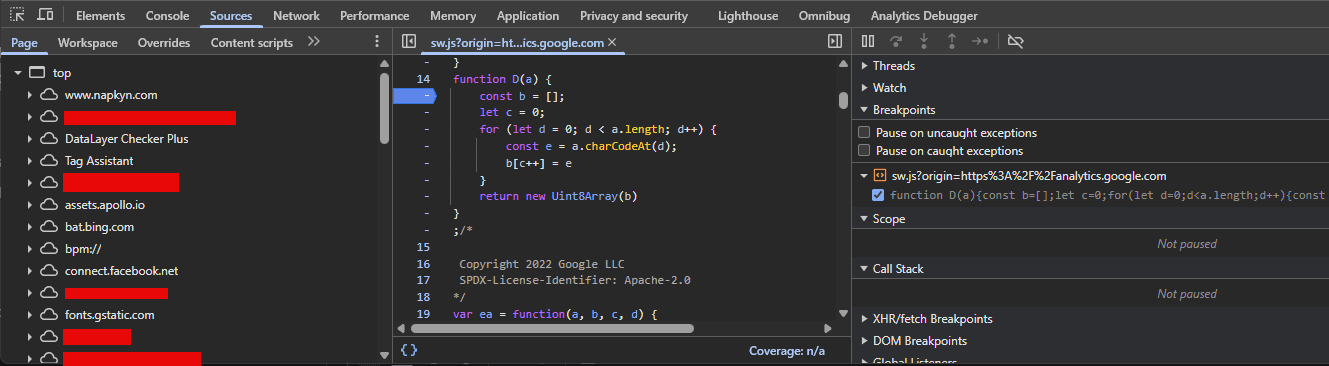
#9 Chrome DevTools (Foundational Analytics Debugging)
Author: Chrome
Where to find it: Built into Chrome
Chrome DevTools is the foundation of analytics debugging. This built-in set of tools allows for detailed inspection of analytics implementations across execution, network activity, and storage.
Sources
The Sources tab is useful for setting breakpoints and stepping through code. It helps diagnose load order issues, unexpected data capture, and implementation breakages by showing how code executes in real time.
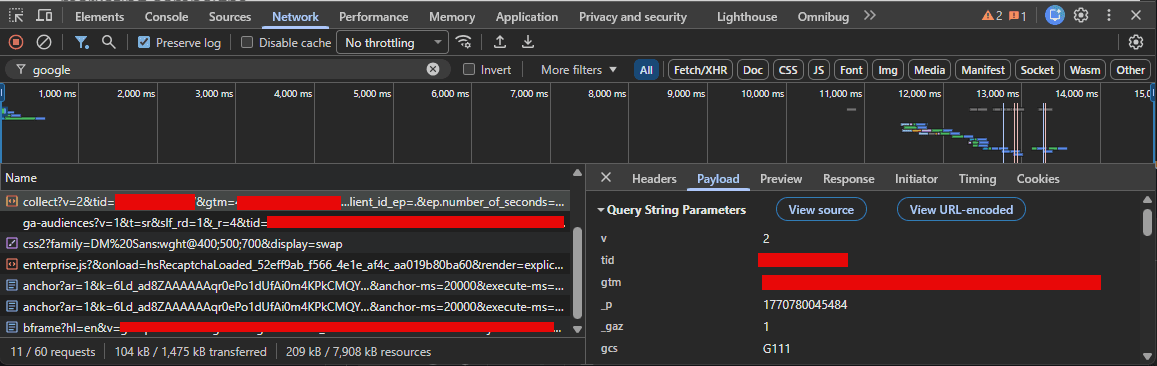
Network
The Network tab displays all requests made by the page, including analytics and marketing hits. It allows inspection of event payloads in their raw form, without abstraction.
Application
The Application tab provides visibility into cookies, local storage, and other storage mechanisms. It is particularly useful for evaluating how analytics tools and consent management platforms store and update data.
Although DevTools requires more effort to master than browser extensions, it offers unmatched transparency. For those without a web development background, learning DevTools provides a deeper understanding of how tags function and how browsers communicate. This visibility often reveals nuances that have a meaningful impact on data collection quality.
Final Thoughts
The Chrome Web Store includes a wide range of extensions that improve productivity for analytics and implementation work. These tools make it easier to inspect data layers, requests, and execution logic during day-to-day debugging.
However, no extension replaces Chrome DevTools. Most extensions rely on the same underlying sources, such as network requests or browser storage, and present that information in a simplified format. Discrepancies can and do occur. A tracking hit may appear in the Network tab but not surface in an extension due to parsing limitations or tool-specific issues.
These tools are valuable accelerators, but they should not be treated as the sole source of truth. Understanding where data originates, how to inspect it in its raw form, and when to question tool output remains critical for maintaining reliable GTM implementations and trustworthy analytics across platforms.
At Napkyn, this discipline is central to how we approach analytics implementation and QA. We help teams design, validate, and maintain GTM-based tracking architectures that work across analytics, marketing platforms, consent frameworks, and server-side environments.
If you are troubleshooting persistent data quality issues, preparing for a complex migration, or want a second set of eyes on your GTM implementation, our team can help you move from ad hoc debugging to a scalable, reliable measurement foundation.
More Insights

Understanding the IAB TCF v2.3 Update: New Vendor Disclosure Requirements Explained

Rob English
Director, Data Solutions
Jun 17, 2026
Read More
How to Choose the Right ETL Tool for Your Data Pipeline

Cem Bakar
Cloud Architect
Jun 10, 2026
Read More

CM360 Path to Conversion Reporting: Full Customer Journey Attribution

Monika Boldak
Associate Director, Marketing
Jun 3, 2026
Read More
More Insights
Sign Up For Our Newsletter

Napkyn Inc.
204-78 George Street, Ottawa, Ontario, K1N 5W1, Canada
Napkyn US
6 East 32nd Street, 9th Floor, New York, NY 10016, USA
212-247-0800 | info@napkyn.com


How to Debug GTM Tags Across Analytics and Marketing Platforms
An overview of GTM tag debugging tools used to validate analytics, marketing platforms, consent behavior, and server-side tracking.
Napkyn
February 10, 2026
Debugging analytics and marketing tags is rarely limited to a single platform. In most modern setups, Google Tag Manager functions as the execution layer for analytics tools, advertising pixels, consent signals, and increasingly, server-side tracking.
Validating these implementations requires more than confirming that a tag fires. Teams must verify that requests are sent at the correct time, include the correct parameters, respect consent conditions, and ultimately deliver accurate data to the intended platforms. This applies across analytics tools, paid media platforms, and supporting infrastructure such as browser storage and server-side endpoints.
To support this work, a wide range of browser extensions and developer tools have emerged. These tools surface data layers, network requests, consent states, and payload details that would otherwise require manual inspection.
Tag debugging refers to the process of validating that analytics and marketing tags fire correctly, send accurate data, respect consent conditions, and deliver payloads to the correct platforms.
This article outlines the debugging tools commonly used to validate GTM-based implementations across analytics and marketing platforms, and explains how each fits into a practical QA and troubleshooting workflow.
#1 Analytics Debugger (GTM and Multi-Platform Tag Debugging)
Author: David Vallejo
Where to find it: Chrome Web Store, Analytics Debugger
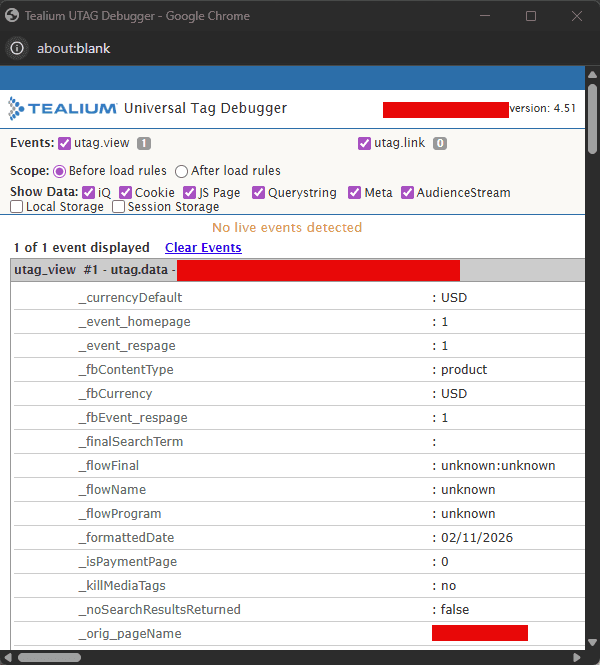
Analytics Debugger is a primary tool for inspecting analytics implementations. While it originally focused on GTM and Google Analytics, it has expanded to support platforms such as Adobe Analytics, Matomo, Piwik Pro, and Tealium.
One of its core strengths is how clearly it exposes the Data Layer on a page, whether that is dataLayer for GTM or utag.data for Tealium. It also detects tag manager containers, analytics tracking IDs, consent mode statuses, and can trigger GA4 Debug Mode.
In addition, it surfaces raw request details and underlying technical payloads. This level of visibility makes it easier to understand what data is leaving the browser and how it is structured. An app version of the extension is also available.
#2 Tealium Tools (Tealium Implementation Debugging)
Author: Tealium.com
Where to find it: Chrome Web Store, Tealium Tools
When working with Tealium implementations, this extension is a core part of the debugging workflow. It provides visibility into tracking activity, hit delivery, and environment switching.
The tool is particularly useful when validating variables, events, and environment-specific behavior in real time. It removes much of the guesswork involved in understanding what is happening behind the scenes during execution.
#3 Stape GTM Helper (Server-Side GTM Debugging)
Author: Stape.io
Where to find it: Chrome Web Store, Stape GTM Helper
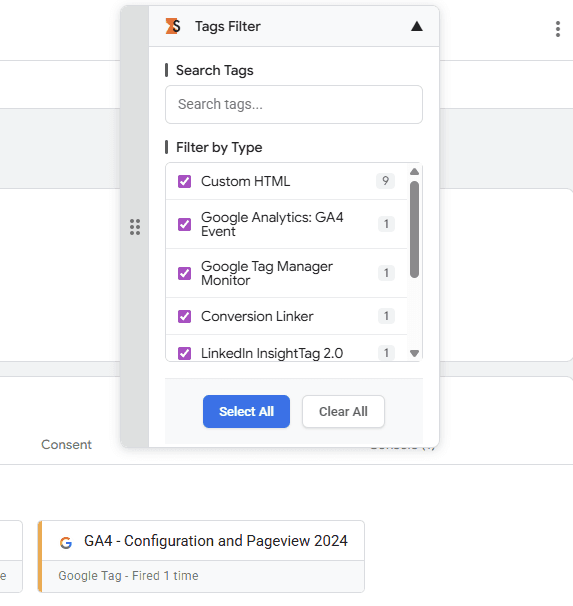
Stape GTM Helper enhances the standard GTM preview experience, with a strong focus on server-side GTM implementations.
Notable features include:
JSON syntax formatting
Cleaner formatting of request URL query parameters
Colour coding for tag types and tag statuses
Visibility into consent status within server-side GTM
These enhancements improve readability and interpretation when working with complex server-side setups, making GTM preview mode more efficient and easier to navigate.
#4 DataLayer Checker Plus (Data Layer Validation for Shopify and GTM)
Author: growthacademy.io
Where to find it: Chrome Web Store, DataLayer Checker Plus
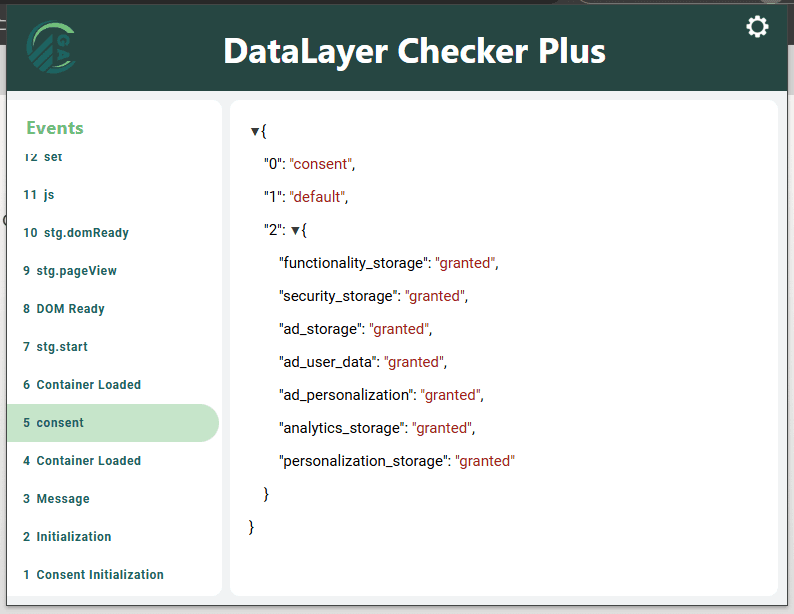
This tool is commonly used to validate Shopify Data Layer implementations, especially in environments involving iFrames and modern pixel-based tracking.
It captures all messages pushed to the Data Layer, whether they occur on page load, through triggered events, or via manual pushes. The data is displayed directly within the extension, removing the need to inspect scripts manually.
Once installed, the extension works out of the box with the default GTM Data Layer. It also supports Shopify Customer Events. If a Data Layer is enabled through that feature, the “Shopify Custom Pixel DataLayer Checker” can be activated in the extension settings. If not, the default configuration still functions as expected.
#5 TikTok Pixel Helper (TikTok Tracking Validation)
Author: TikTok For Business
Where to find it: Chrome Web Store, TikTok Pixel Helper
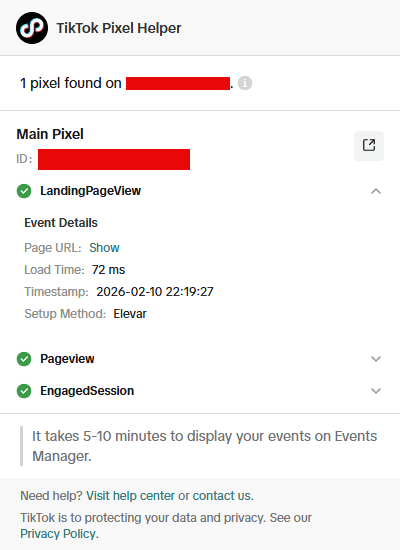
TikTok Pixel Helper is used to confirm whether TikTok tracking is firing correctly and to review which events are being sent.
The tool highlights errors and warnings, making it especially useful when debugging custom implementations or server-side TikTok pixels. It provides a clear view of what is working and what requires adjustment.
#6 Meta Pixel Helper (Meta and Facebook Pixel Debugging)
Author: Meta (Facebook)
Where to find it: Chrome Web Store, Meta Pixel Helper
Meta Pixel Helper is essential for validating Facebook and Instagram tracking. It detects the Meta Pixel on a page, lists all triggered events, and flags warnings or errors such as missing parameters or incorrect event firing.
It is particularly useful during audits or when validating changes to Meta advertising implementations.
#7 Google Tag Assistant (Google Tag Validation)
Author: Google
Where to find it: Chrome Web Store, Tag Assistant
Tag Assistant is a long-standing tool for checking whether Google tags such as Google Analytics, Google Tag Manager, and Google Ads are firing correctly.
While it is less feature-rich than some newer tools, it remains useful for identifying issues such as duplicate tags, missing IDs, or basic configuration errors.
The extension integrates with tagassistant.google.com and allows users to activate debug mode through the “Troubleshoot” option. This enables deeper inspection of implementations, including activity within iframes, all within a single session that can be reviewed later.
#8 Omnibug (Network-Level Tag Inspection)
Author: Philip Lawrence
Where to find it: Chrome Web Store, Omnibug
Omnibug is a powerful tool for inspecting analytics and marketing tags at the network level. It decodes requests from platforms such as Adobe Analytics, GA4, Meta, TikTok, and others, presenting payloads in a human-readable format.
This is especially valuable when troubleshooting complex issues or comparing request structures across multiple platforms. It significantly reduces the time required to understand what data is being sent.
#9 Chrome DevTools (Foundational Analytics Debugging)
Author: Chrome
Where to find it: Built into Chrome
Chrome DevTools is the foundation of analytics debugging. This built-in set of tools allows for detailed inspection of analytics implementations across execution, network activity, and storage.
Sources
The Sources tab is useful for setting breakpoints and stepping through code. It helps diagnose load order issues, unexpected data capture, and implementation breakages by showing how code executes in real time.
Network
The Network tab displays all requests made by the page, including analytics and marketing hits. It allows inspection of event payloads in their raw form, without abstraction.
Application
The Application tab provides visibility into cookies, local storage, and other storage mechanisms. It is particularly useful for evaluating how analytics tools and consent management platforms store and update data.
Although DevTools requires more effort to master than browser extensions, it offers unmatched transparency. For those without a web development background, learning DevTools provides a deeper understanding of how tags function and how browsers communicate. This visibility often reveals nuances that have a meaningful impact on data collection quality.
Final Thoughts
The Chrome Web Store includes a wide range of extensions that improve productivity for analytics and implementation work. These tools make it easier to inspect data layers, requests, and execution logic during day-to-day debugging.
However, no extension replaces Chrome DevTools. Most extensions rely on the same underlying sources, such as network requests or browser storage, and present that information in a simplified format. Discrepancies can and do occur. A tracking hit may appear in the Network tab but not surface in an extension due to parsing limitations or tool-specific issues.
These tools are valuable accelerators, but they should not be treated as the sole source of truth. Understanding where data originates, how to inspect it in its raw form, and when to question tool output remains critical for maintaining reliable GTM implementations and trustworthy analytics across platforms.
At Napkyn, this discipline is central to how we approach analytics implementation and QA. We help teams design, validate, and maintain GTM-based tracking architectures that work across analytics, marketing platforms, consent frameworks, and server-side environments.
If you are troubleshooting persistent data quality issues, preparing for a complex migration, or want a second set of eyes on your GTM implementation, our team can help you move from ad hoc debugging to a scalable, reliable measurement foundation.
More Insights

Adblockers and Consent Management: Why Server-Side Tagging Is Not a Workaround
Rob English
Director, Data Solutions
Jun 24, 2026
Read More
Understanding the IAB TCF v2.3 Update: New Vendor Disclosure Requirements Explained
Rob English
Director, Data Solutions
Jun 17, 2026
Read More
How to Choose the Right ETL Tool for Your Data Pipeline
Cem Bakar
Cloud Architect
Jun 10, 2026
Read More
More Insights
Sign Up For Our Newsletter