

Why GA4, Google Ads, and BigQuery Numbers Don’t Match
GA4, Google Ads, and BigQuery often report different numbers. Learn why attribution, identity, and modeling create gaps, and how to decide which source to use.

Chris Wright
Associate Director, Training and Development
“Our numbers don’t match.”
If you work in marketing, analytics, or reporting, you have probably had this conversation more than once. Google Ads shows one number, GA4 shows another, and BigQuery gives you something different again.
The instinct is usually to ask which number is right. But that is not always the best place to start.
GA4, Google Ads, and BigQuery are not designed to answer the same question. Google Ads is built for media optimization, GA4 is built for reporting and analysis, and BigQuery gives you access to the raw collected data. Once you understand those roles, the discrepancies become easier to explain and easier to manage.
The wrong question
Most teams that are paying attention to their data in several tools eventually ask:
“Why aren’t these numbers the same? Shouldn’t they be the same?!?”
This is usually where the conversation starts.It sounds reasonable, but it assumes these platforms are trying to do the same thing in the same way.
They aren’t.
When you treat them as interchangeable, you end up chasing differences that aren’t actually problems.
A better way to think about it
A more useful question is:
“What is each system designed to do?”
Once you answer that, the discrepancies stop feeling random. They start to look predictable. At a high level, each platform has a role.
Google Ads is built for optimization.
GA4 is built for reporting.
BigQuery is there to validate and investigate.
Each one is doing its job. The friction comes from expecting them to behave the same way. At a high level, it looks like this:
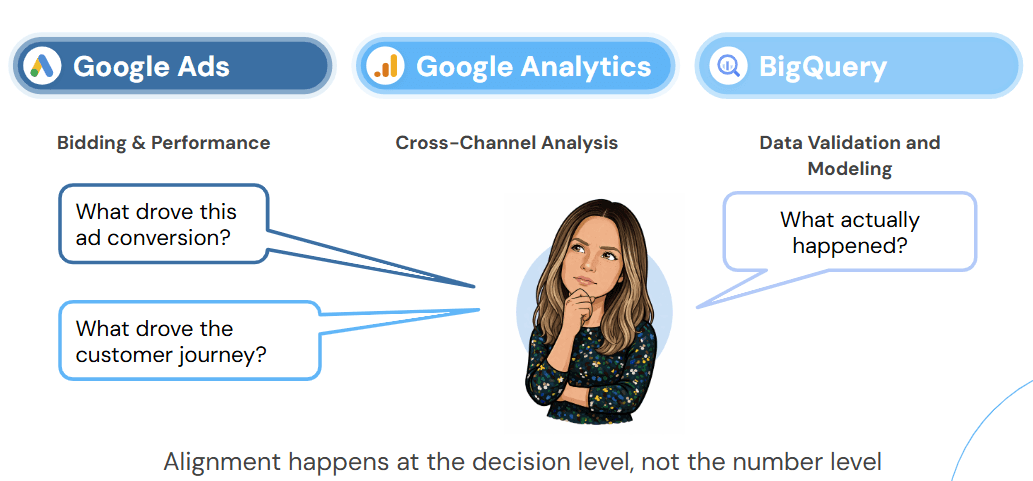
Why Marketing Numbers Don’t Match Across Platforms
Here’s what this usually looks like in practice:
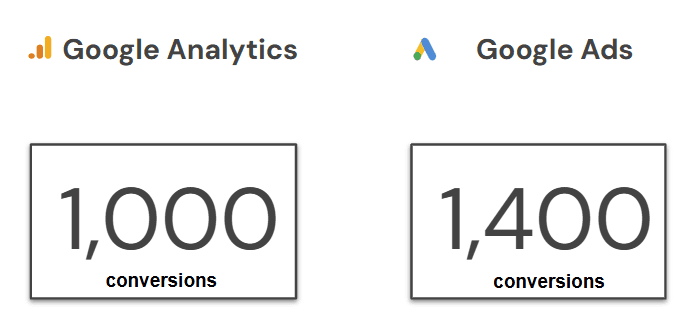
Even when the same underlying signal exists, each platform treats it differently.
There are a few consistent reasons this happens.
Attribution is one. Different models assign credit in different ways, so the same conversion can show up in different places depending on how that credit is distributed.
Identity is another. Each platform has its own way of defining a user. Cross-device behavior, consent, and session logic all influence who actually gets counted.
And then there’s modeling. Some platforms fill in gaps where data is missing.
GA4 does this in a few ways. It uses modeling to estimate conversions and behavior when users don’t consent to tracking or can’t be tied back to a source. BigQuery doesn’t do that. It just shows you what was collected.
That alone explains a lot of the gap people see.
This is what that actually looks like:
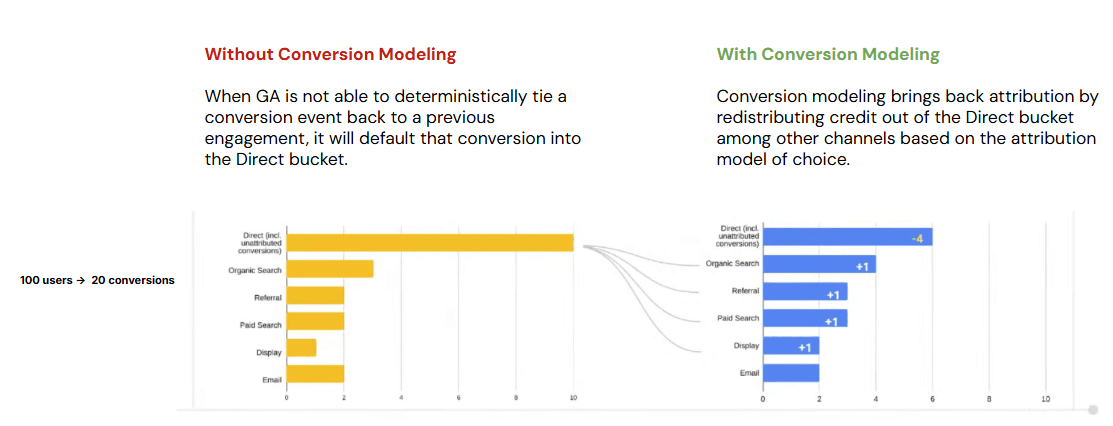
Why GA4 and BigQuery Show Different Conversion Counts
This is where things tend to get confusing.
GA4 is not just showing you what happened. It’s interpreting what it can see and filling in gaps where it can’t. BigQuery is just the raw record. No modeling, no reconstruction.
So when GA4 shows more conversions than BigQuery, it’s not because one is wrong. It’s because one is completing the picture and the other is showing you exactly what was captured.
Same behavior, different interpretation.
This is the simplest way to think about it:
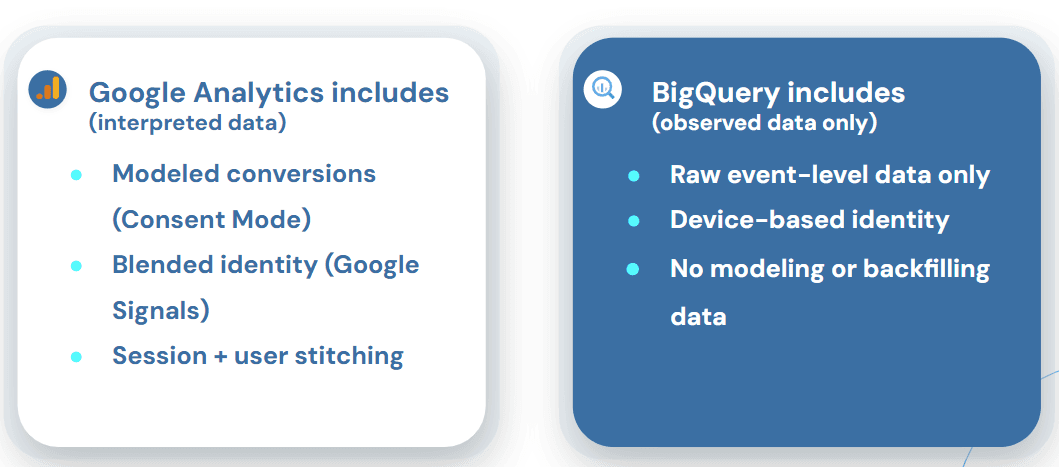
Why GA4 Reports Can Differ From GA4 Explore
This catches people off guard. You can look at the same event in different parts of GA4 and get different numbers.That’s not inconsistency. It’s design.
Standard reports are meant to answer “how are we performing?” They’re structured and consistent.
Explore is built for digging deeper. You’re shaping the dataset yourself, which means you can answer more specific questions, but you can also introduce variation depending on how you build it.
And BigQuery sits underneath both. It’s just the raw data.
So when you move between these, you’re not just changing views. You’re changing the question you’re asking. Different questions will give you different answers.
How to Decide Which Number to Trust
Most teams get to this point and understand why things don’t match. But they still struggle.
Not because the data is unclear, but because there isn’t a consistent way to deal with it.
The same question comes up again and again. The same analysis gets repeated. Different people explain it in different ways.
At that point, it’s not a data issue anymore. It’s a decision and communication issue.
How to Explain Data Discrepancies Internally
What helps is having a simple way to approach this every time.
Start with the definition. Not just how the event fires, but what each platform is actually counting as a conversion. The same signal can be treated differently depending on how it’s configured and interpreted downstream.
Once that’s clear, the next step is deciding how each system is used.
Google Ads is where optimization decisions happen.
GA4 is your reporting layer.
BigQuery is where you go when you need to validate or dig deeper.
When numbers don’t match, the question isn’t “which one is right?” It’s “which one is responsible for this decision?”
From there, you’re not trying to make the numbers line up. You’re trying to understand whether the difference is expected.
In most cases, it is.
Google Ads will often be higher than GA4.
GA4 will often be higher than BigQuery.
The more useful signal is direction. If everything is moving the same way, your data is usually in a good place.
When something breaks that pattern, that’s when it’s worth investigating.
A simple way to decide:
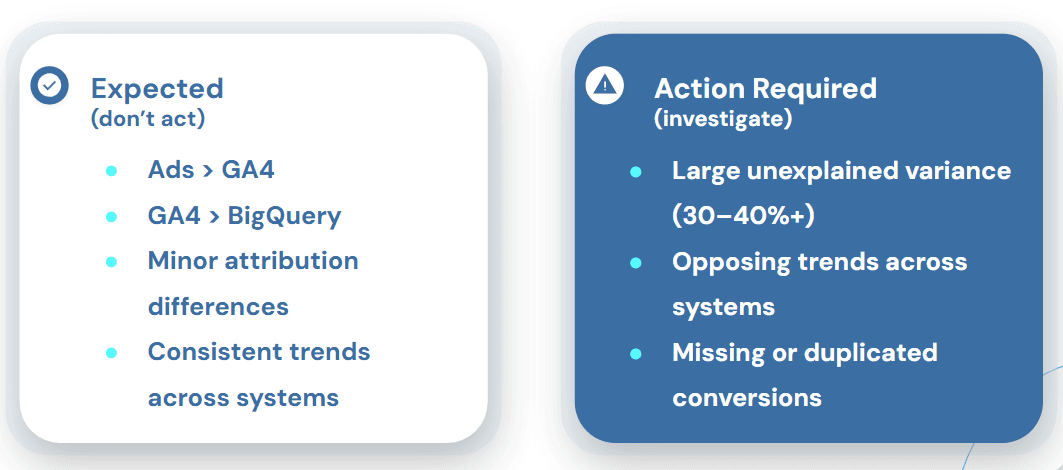
And when you do investigate, the explanation almost always comes back to the same few things. Attribution, identity, or modeling.
If you can point to one of those, you can explain the difference.
Don’t solve the same problem twice
This is the step that gets skipped most often.
Teams figure out why something doesn’t match, explain it once, and then go through the same process again the next time it comes up.
A better approach is to document it.
Write the explanation once in a way that’s clear and reusable. Use it in your reporting, your dashboards, and your internal conversations.
If it’s not documented, it’s not really solved.
What this looks like when it’s working
You know you’re in a good place when you can explain discrepancies quickly and consistently.
You’re not having the same debate every week. Different teams aren’t giving different answers. Stakeholders aren’t pushing back every time the numbers don’t align perfectly.
At that point, the goal isn’t to make everything match. It’s to make everything understandable.
Final Thoughts: The Goal Is Clarity, Not Perfect Matching
The goal is not to force GA4, Google Ads, and BigQuery to match perfectly. In most cases, they will not, and that is expected.
The better goal is to understand what each platform is counting, why the differences exist, and which source should guide each decision. Google Ads may be the right place for optimization, GA4 may be the right place for performance reporting, and BigQuery may be the right place for validation and deeper investigation.
When teams document those rules, discrepancies become much easier to explain. The conversation shifts from “Which number is right?” to “Which number is right for this decision?”
More Insights

Building Scalable Serverless Data Pipelines on Google Cloud

Cem Bakar
Cloud Architect
Oct 7, 2026
Read More

Understanding the IAB TCF v2.3 Update: New Vendor Disclosure Requirements Explained

Rob English
Director, Data Solutions
Jun 17, 2026
Read More

CM360 Path to Conversion Reporting: Full Customer Journey Attribution

Monika Boldak
Associate Director, Marketing
Jun 3, 2026
Read More
More Insights
Sign Up For Our Newsletter

Napkyn Inc.
204-78 George Street, Ottawa, Ontario, K1N 5W1, Canada
Napkyn US
6 East 32nd Street, 9th Floor, New York, NY 10016, USA
212-247-0800 | info@napkyn.com


Why GA4, Google Ads, and BigQuery Numbers Don’t Match
GA4, Google Ads, and BigQuery often report different numbers. Learn why attribution, identity, and modeling create gaps, and how to decide which source to use.
Chris Wright
Associate Director, Training and Development
July 15, 2026
“Our numbers don’t match.”
If you work in marketing, analytics, or reporting, you have probably had this conversation more than once. Google Ads shows one number, GA4 shows another, and BigQuery gives you something different again.
The instinct is usually to ask which number is right. But that is not always the best place to start.
GA4, Google Ads, and BigQuery are not designed to answer the same question. Google Ads is built for media optimization, GA4 is built for reporting and analysis, and BigQuery gives you access to the raw collected data. Once you understand those roles, the discrepancies become easier to explain and easier to manage.
The wrong question
Most teams that are paying attention to their data in several tools eventually ask:
“Why aren’t these numbers the same? Shouldn’t they be the same?!?”
This is usually where the conversation starts.It sounds reasonable, but it assumes these platforms are trying to do the same thing in the same way.
They aren’t.
When you treat them as interchangeable, you end up chasing differences that aren’t actually problems.
A better way to think about it
A more useful question is:
“What is each system designed to do?”
Once you answer that, the discrepancies stop feeling random. They start to look predictable. At a high level, each platform has a role.
Google Ads is built for optimization.
GA4 is built for reporting.
BigQuery is there to validate and investigate.
Each one is doing its job. The friction comes from expecting them to behave the same way. At a high level, it looks like this:
Why Marketing Numbers Don’t Match Across Platforms
Here’s what this usually looks like in practice:
Even when the same underlying signal exists, each platform treats it differently.
There are a few consistent reasons this happens.
Attribution is one. Different models assign credit in different ways, so the same conversion can show up in different places depending on how that credit is distributed.
Identity is another. Each platform has its own way of defining a user. Cross-device behavior, consent, and session logic all influence who actually gets counted.
And then there’s modeling. Some platforms fill in gaps where data is missing.
GA4 does this in a few ways. It uses modeling to estimate conversions and behavior when users don’t consent to tracking or can’t be tied back to a source. BigQuery doesn’t do that. It just shows you what was collected.
That alone explains a lot of the gap people see.
This is what that actually looks like:
Why GA4 and BigQuery Show Different Conversion Counts
This is where things tend to get confusing.
GA4 is not just showing you what happened. It’s interpreting what it can see and filling in gaps where it can’t. BigQuery is just the raw record. No modeling, no reconstruction.
So when GA4 shows more conversions than BigQuery, it’s not because one is wrong. It’s because one is completing the picture and the other is showing you exactly what was captured.
Same behavior, different interpretation.
This is the simplest way to think about it:
Why GA4 Reports Can Differ From GA4 Explore
This catches people off guard. You can look at the same event in different parts of GA4 and get different numbers.That’s not inconsistency. It’s design.
Standard reports are meant to answer “how are we performing?” They’re structured and consistent.
Explore is built for digging deeper. You’re shaping the dataset yourself, which means you can answer more specific questions, but you can also introduce variation depending on how you build it.
And BigQuery sits underneath both. It’s just the raw data.
So when you move between these, you’re not just changing views. You’re changing the question you’re asking. Different questions will give you different answers.
How to Decide Which Number to Trust
Most teams get to this point and understand why things don’t match. But they still struggle.
Not because the data is unclear, but because there isn’t a consistent way to deal with it.
The same question comes up again and again. The same analysis gets repeated. Different people explain it in different ways.
At that point, it’s not a data issue anymore. It’s a decision and communication issue.
How to Explain Data Discrepancies Internally
What helps is having a simple way to approach this every time.
Start with the definition. Not just how the event fires, but what each platform is actually counting as a conversion. The same signal can be treated differently depending on how it’s configured and interpreted downstream.
Once that’s clear, the next step is deciding how each system is used.
Google Ads is where optimization decisions happen.
GA4 is your reporting layer.
BigQuery is where you go when you need to validate or dig deeper.
When numbers don’t match, the question isn’t “which one is right?” It’s “which one is responsible for this decision?”
From there, you’re not trying to make the numbers line up. You’re trying to understand whether the difference is expected.
In most cases, it is.
Google Ads will often be higher than GA4.
GA4 will often be higher than BigQuery.
The more useful signal is direction. If everything is moving the same way, your data is usually in a good place.
When something breaks that pattern, that’s when it’s worth investigating.
A simple way to decide:
And when you do investigate, the explanation almost always comes back to the same few things. Attribution, identity, or modeling.
If you can point to one of those, you can explain the difference.
Don’t solve the same problem twice
This is the step that gets skipped most often.
Teams figure out why something doesn’t match, explain it once, and then go through the same process again the next time it comes up.
A better approach is to document it.
Write the explanation once in a way that’s clear and reusable. Use it in your reporting, your dashboards, and your internal conversations.
If it’s not documented, it’s not really solved.
What this looks like when it’s working
You know you’re in a good place when you can explain discrepancies quickly and consistently.
You’re not having the same debate every week. Different teams aren’t giving different answers. Stakeholders aren’t pushing back every time the numbers don’t align perfectly.
At that point, the goal isn’t to make everything match. It’s to make everything understandable.
Final Thoughts: The Goal Is Clarity, Not Perfect Matching
The goal is not to force GA4, Google Ads, and BigQuery to match perfectly. In most cases, they will not, and that is expected.
The better goal is to understand what each platform is counting, why the differences exist, and which source should guide each decision. Google Ads may be the right place for optimization, GA4 may be the right place for performance reporting, and BigQuery may be the right place for validation and deeper investigation.
When teams document those rules, discrepancies become much easier to explain. The conversation shifts from “Which number is right?” to “Which number is right for this decision?”
More Insights
Building Scalable Serverless Data Pipelines on Google Cloud
Cem Bakar
Cloud Architect
Oct 7, 2026
Read More

The Most Durable AI Investment: A Strong Data Foundation

Jasmine Libert
Senior VP Growth and GTM
Sep 28, 2026
Read More

How to Detect Google Analytics Tracking Issues Early with Automated QA

Skylar van Dalen-Flude
Senior Data Analyst
Aug 26, 2026
Read More
More Insights
Sign Up For Our Newsletter