
Menu

Simple GA4 Scroll Depth Tracking Setup: Boost User Engagement
Learn how to easily set up scroll depth tracking in GA4. Understand user behavior, improve content, and increase engagement with our step-by-step guide

Ricardo Cristofolini
I’m passionate about what I do. If you meet my manager or co-workers, they would say I’m a team player, engaged and always excited to learn something new. Like everyone else I have some flaws. However I’m not afraid to work around those to bring the best in myself and for the company.
If you’re already using Google Analytics 4 (GA4) you undoubtedly know it includes, among other things, a default built-in scroll tracking. The GA4's default scroll event activates when a user has scrolled through approximately 90% of the page and that’s it. However, analyzing user behaviour at 50% or even 25% can reveal valuable data on content consumption. For example, some websites have an Up Button that when clicked, takes the user all the way to the top of the page. By having the 25%, 50%, and/or 75% data mapped to the Up Button event, you would gain an understanding of where users stop reading your content.
In this case, if you have a promotion banner close to the bottom of your site, it will likely not have a lot of interactions. By optimizing accordingly, you can enhance the user experience, improve your website content and drive better results.
How To Set Up Scroll Depth Tracking
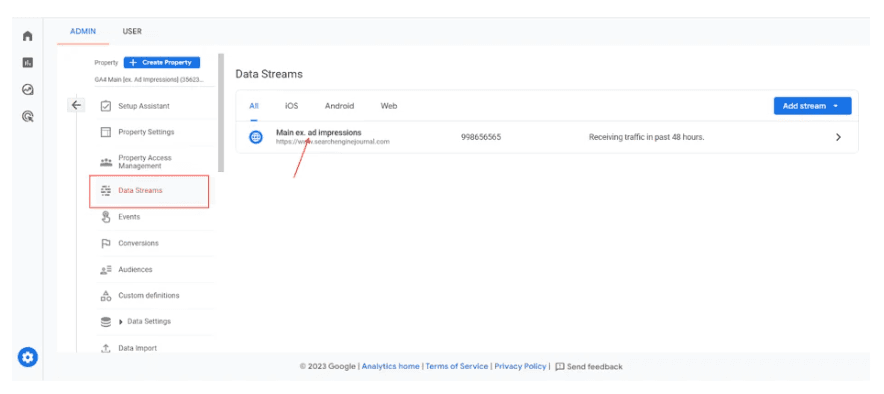
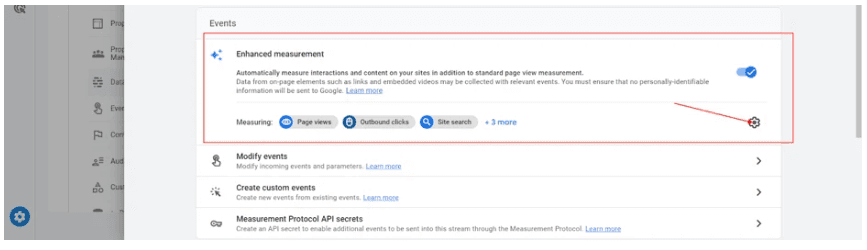
The first step is to disable the default scroll tracking from the Enhanced Measurement stream. The reason we’re doing this is to avoid duplicate tracking of the Scroll Event since we’re going to implement it manually.
Go to Data Streams > Click on the Web Stream. Keep in mind only Web Streams have the Enhanced Measurement default tracking. If you have App streams, this does not apply to you.
Disable scroll tracking in the popup dialogue.
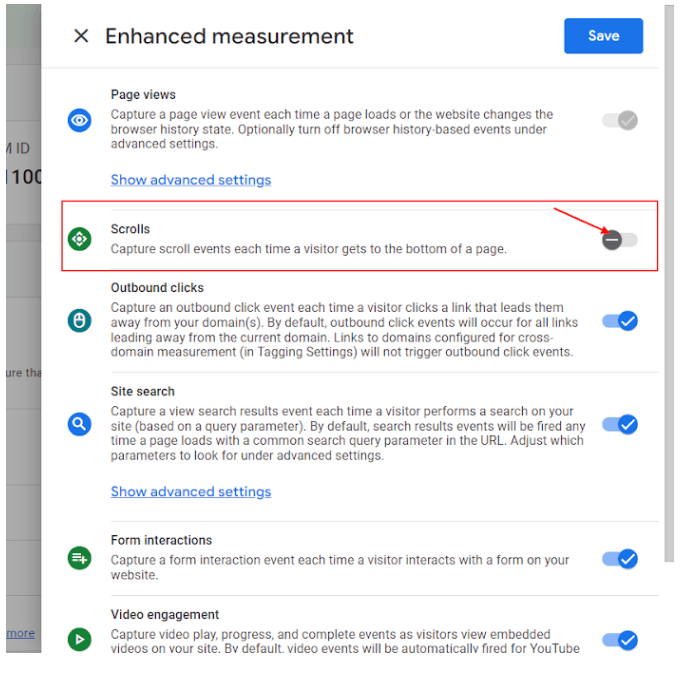
From this point, you no longer have the default Scroll event tracking. The next step is to configure the new Scroll event.
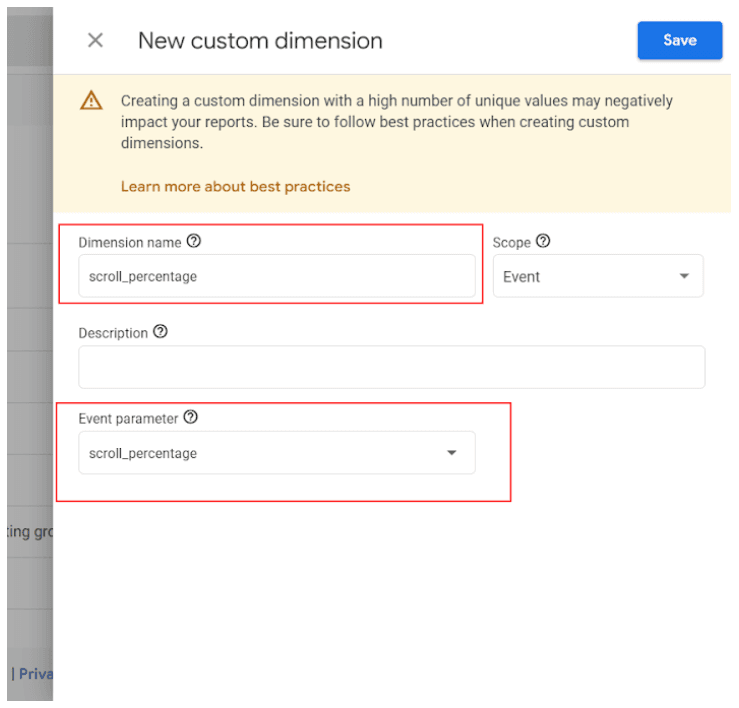
Go to the Custom Definitions setting page and create a custom dimension “scroll_percentage” (name it based on your naming conventions). Quick tip: the Event Parameter is usually available automatically if data had already been received in GA4. However, if you don’t see the parameter you’re looking for, you can either write it down manually, or wait another 24hrs for the data to flow in.
At this point you’ll need to access Google Tag Manager (GTM). Don’t worry as this solution is “code-free” and you won’t need the help of a developer or touch the website code. GTM has everything you need to get this up and running.
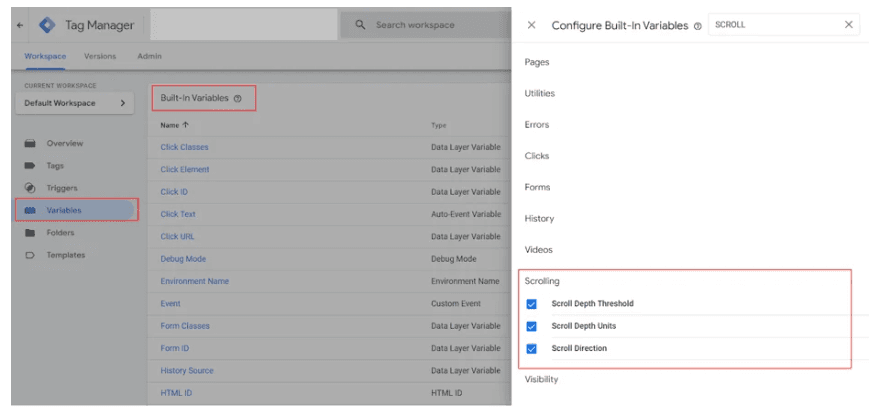
Go to Variables in Google Tag Manager, click Configure and enable the following built-in variables:
Scroll Depth Threshold.
Scroll Depth Units.
Scroll Direction.
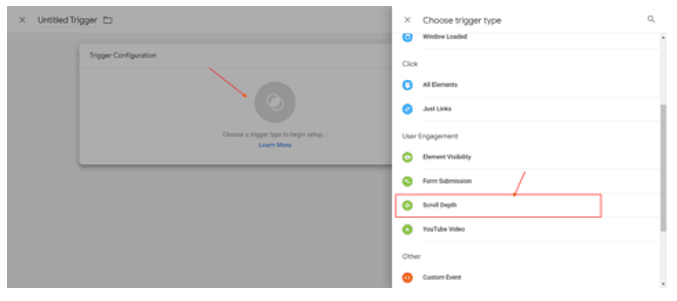
Go to Triggers, click New to add a new trigger, then click anywhere inside the Trigger Configuration box and add a scroll depth trigger named “Custom Scroll” under User Engagement list.
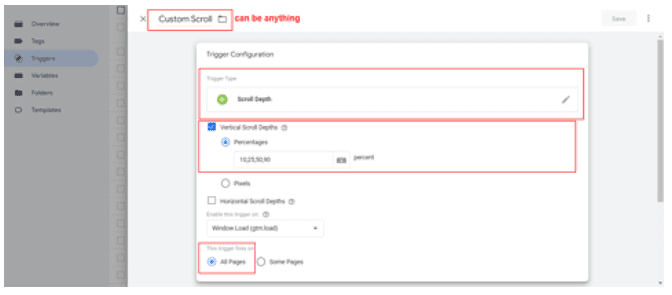
Select Vertical Scroll Depth (unless your website moves side to side) and add the scroll depth levels you wish to track as a comma-separated list in the "Percentages" settings. Personally, we would suggest 25%, 50%, 75%, and 100%, but what to track is really up to you and your Goals.
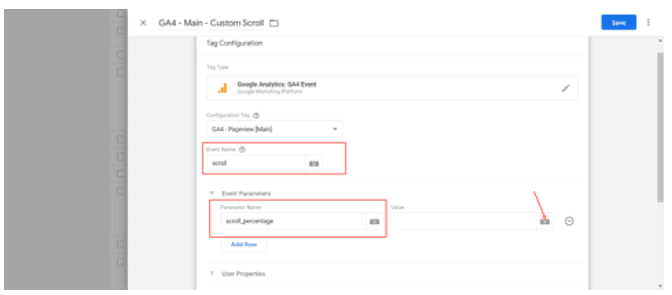
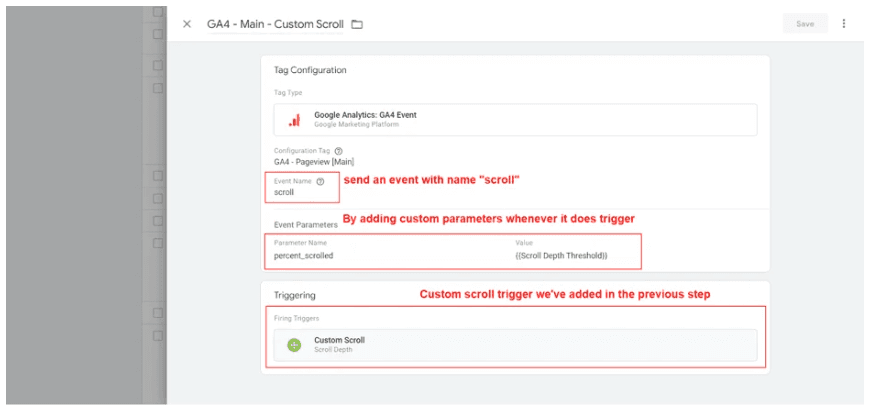
Add an Event tag in “Tags”.
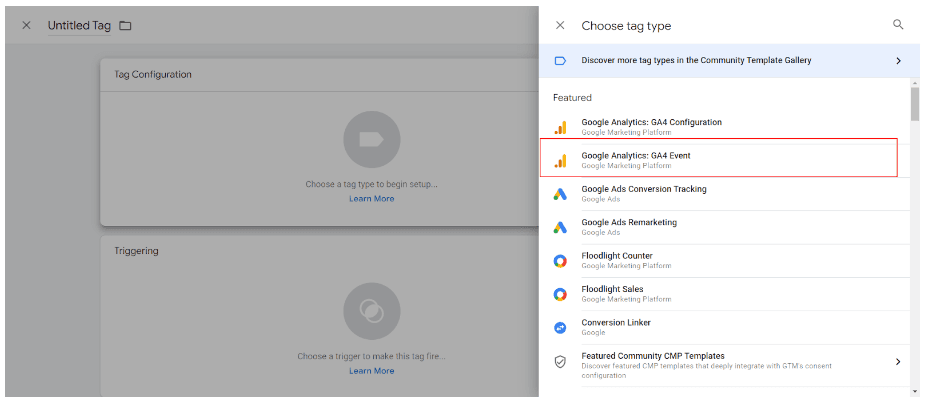
Type “scroll in the event name, and set the custom parameter to “scroll_percentage.” Quick tip: Keep in mind that the parameter name MUST BE the same as the one you registered in step 3. Otherwise, GTM won’t know where to send the data.
Quick tip 2: Keep an eye out for the event name. If you had the Enhancement Measurement scroll activated before and collected some events, you will likely see that data in the new scroll event you created. For example, the 90%. The reason for that is due to the same event name: Scroll. GA4 will aggregate everything under the same location. It’s not the end of the world, but it’s good to know in case you see this in the reports.
9. Choose the Custom Scroll trigger.
Preview your configuration to make sure everything is working as expected. If it is, publish the updates.
Now that you have scroll depth tracking setup, you’ll probably want to set up a report. Follow the directions below to do this in Explorations. Note, if you use Looker you can also create a dashboard that shows the articles with scroll depth, but for today, let’s focus on Explorations.
How To Create Scroll Depth Report In Explorations
At the 24 hrmark you should be able to see the newly created event data in GA4 reports. Your first stop would be Reports > Engagement > Events > Scroll. Here you will be able to see the number of events and the Scroll Depth in one of the cards below.
Another option is the Exploration report which would give you unsampled data.
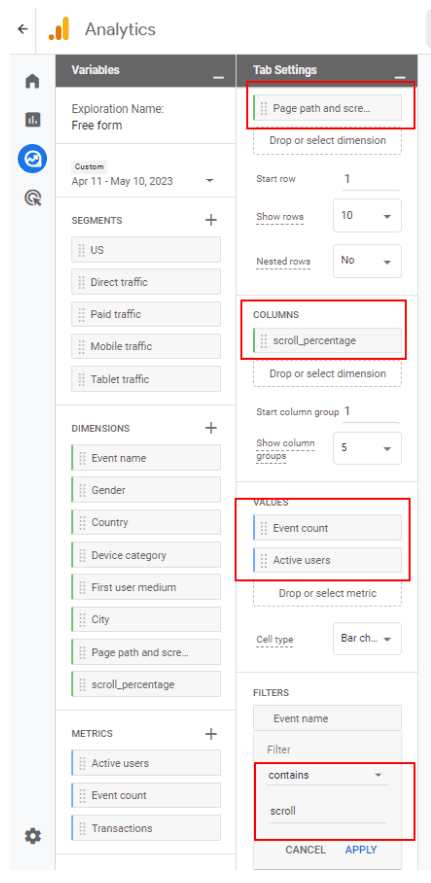
To create a scroll depth report in explorations, go to Explore and create a blank “Free Form” report.
Add dimensions like “Page path” and “scroll_percentage.” Don’t forget to filter only events with the name “scroll.”
Build the report using this screenshot as an example:
It’s also a good idea to set conversions based on scroll depth, but we’ll leave that for another day.
Conclusion
Scroll depth tracking is a great feature included by default in GA4. However, the default only tracks when someone scrolls below the 90% mark of the page height. If you want to track other thresholds for example 25% or 75% you have to customize it. Once you start collecting this data it’s a creative source for improving your site’s user experience.
At Napkyn, we keep track of the latest Google Analytics 4 developments and post updates to ensure you are always in the loop regarding new features and how to use them. Sign up for our monthly newsletter to get the latest scoop on Google Analytics 4 as well as useful guides for getting the most out of this platform.
Have questions about transitioning or getting the most out of your GA4 implementation? Contact us.
More Insights

Ready for What? AI Readiness in Marketing Today

Jasmine Libert
Senior Vice President, Data Solutions
Apr 30, 2025
Read More

BigQuery for Marketers: Combine GA4, Google Ads & CRM Data for Smarter Decision

Shreya Banker
Data Scientist
Apr 23, 2025
Read More

How to Audit Google Analytics 4 (GA4): Common Issues and Their Impacts on Your Data

Hasan Alanam
Manager, Data Solutions
Apr 7, 2025
Read More
More Insights
Sign Up For Our Newsletter
Napkyn Inc.
204-78 George Street, Ottawa, Ontario, K1N 5W1, Canada
Napkyn US
6 East 32nd Street, 9th Floor, New York, NY 10016, USA
212-247-0800 | info@napkyn.com


Simple GA4 Scroll Depth Tracking Setup: Boost User Engagement
Learn how to easily set up scroll depth tracking in GA4. Understand user behavior, improve content, and increase engagement with our step-by-step guide
Ricardo Cristofolini
I’m passionate about what I do. If you meet my manager or co-workers, they would say I’m a team player, engaged and always excited to learn something new. Like everyone else I have some flaws. However I’m not afraid to work around those to bring the best in myself and for the company.
If you’re already using Google Analytics 4 (GA4) you undoubtedly know it includes, among other things, a default built-in scroll tracking. The GA4's default scroll event activates when a user has scrolled through approximately 90% of the page and that’s it. However, analyzing user behaviour at 50% or even 25% can reveal valuable data on content consumption. For example, some websites have an Up Button that when clicked, takes the user all the way to the top of the page. By having the 25%, 50%, and/or 75% data mapped to the Up Button event, you would gain an understanding of where users stop reading your content.
In this case, if you have a promotion banner close to the bottom of your site, it will likely not have a lot of interactions. By optimizing accordingly, you can enhance the user experience, improve your website content and drive better results.
How To Set Up Scroll Depth Tracking
The first step is to disable the default scroll tracking from the Enhanced Measurement stream. The reason we’re doing this is to avoid duplicate tracking of the Scroll Event since we’re going to implement it manually.
Go to Data Streams > Click on the Web Stream. Keep in mind only Web Streams have the Enhanced Measurement default tracking. If you have App streams, this does not apply to you.
Disable scroll tracking in the popup dialogue.
From this point, you no longer have the default Scroll event tracking. The next step is to configure the new Scroll event.
Go to the Custom Definitions setting page and create a custom dimension “scroll_percentage” (name it based on your naming conventions). Quick tip: the Event Parameter is usually available automatically if data had already been received in GA4. However, if you don’t see the parameter you’re looking for, you can either write it down manually, or wait another 24hrs for the data to flow in.
At this point you’ll need to access Google Tag Manager (GTM). Don’t worry as this solution is “code-free” and you won’t need the help of a developer or touch the website code. GTM has everything you need to get this up and running.
Go to Variables in Google Tag Manager, click Configure and enable the following built-in variables:
Scroll Depth Threshold.
Scroll Depth Units.
Scroll Direction.
Go to Triggers, click New to add a new trigger, then click anywhere inside the Trigger Configuration box and add a scroll depth trigger named “Custom Scroll” under User Engagement list.
Select Vertical Scroll Depth (unless your website moves side to side) and add the scroll depth levels you wish to track as a comma-separated list in the "Percentages" settings. Personally, we would suggest 25%, 50%, 75%, and 100%, but what to track is really up to you and your Goals.
Add an Event tag in “Tags”.
Type “scroll in the event name, and set the custom parameter to “scroll_percentage.” Quick tip: Keep in mind that the parameter name MUST BE the same as the one you registered in step 3. Otherwise, GTM won’t know where to send the data.
Quick tip 2: Keep an eye out for the event name. If you had the Enhancement Measurement scroll activated before and collected some events, you will likely see that data in the new scroll event you created. For example, the 90%. The reason for that is due to the same event name: Scroll. GA4 will aggregate everything under the same location. It’s not the end of the world, but it’s good to know in case you see this in the reports.
9. Choose the Custom Scroll trigger.
Preview your configuration to make sure everything is working as expected. If it is, publish the updates.
Now that you have scroll depth tracking setup, you’ll probably want to set up a report. Follow the directions below to do this in Explorations. Note, if you use Looker you can also create a dashboard that shows the articles with scroll depth, but for today, let’s focus on Explorations.
How To Create Scroll Depth Report In Explorations
At the 24 hrmark you should be able to see the newly created event data in GA4 reports. Your first stop would be Reports > Engagement > Events > Scroll. Here you will be able to see the number of events and the Scroll Depth in one of the cards below.
Another option is the Exploration report which would give you unsampled data.
To create a scroll depth report in explorations, go to Explore and create a blank “Free Form” report.
Add dimensions like “Page path” and “scroll_percentage.” Don’t forget to filter only events with the name “scroll.”
Build the report using this screenshot as an example:
It’s also a good idea to set conversions based on scroll depth, but we’ll leave that for another day.
Conclusion
Scroll depth tracking is a great feature included by default in GA4. However, the default only tracks when someone scrolls below the 90% mark of the page height. If you want to track other thresholds for example 25% or 75% you have to customize it. Once you start collecting this data it’s a creative source for improving your site’s user experience.
At Napkyn, we keep track of the latest Google Analytics 4 developments and post updates to ensure you are always in the loop regarding new features and how to use them. Sign up for our monthly newsletter to get the latest scoop on Google Analytics 4 as well as useful guides for getting the most out of this platform.
Have questions about transitioning or getting the most out of your GA4 implementation? Contact us.
More Insights
Ready for What? AI Readiness in Marketing Today
Jasmine Libert
Senior Vice President, Data Solutions
Apr 30, 2025
Read More
BigQuery for Marketers: Combine GA4, Google Ads & CRM Data for Smarter Decision
Shreya Banker
Data Scientist
Apr 23, 2025
Read More

How to Set Up GA4 Ecommerce Tracking (Without Data Loss) | A Complete Step-by-Step Guide

Ricardo Cristofolini
Senior Implementation Specialist, Data Solutions
Apr 16, 2025
Read More
More Insights
Sign Up For Our Newsletter