

What is this new feature about?
How many default reports in Google Analytics does your team use on a regular basis? I bet not too many, and those they do use need adjustments to be useful? Thankfully, you don’t have to suffer anymore! Google has rolled out a new feature in Google Analytics 4 (GA4) that lets your company customize which reports you see in the report navigation. This means that if you are a non-eCommerce business, you don’t have to see ‘Monetization’ reports in GA4. What a relief!
How does it work?
A user with ‘Edit’ permission to the GA4 property can remove, add, adjust, create a new set of reports that are visible to all users of that GA4 property.
What does it mean for your business?
All GA4 users in your company will see data that is relevant to the business. A lot of times, somebody who is a light user goes into the tool and sees millions of dimensions and metrics, gets lost, and is scared to use the data. They never come back for more. With customizable navigation where names of the collections and topics, and the dimensions and metrics are controlled, the navigation can be simple and relevant.
Where to start?
Create a structure and name the Collections and Topics in a way that suits your business needs. You can set up 7 collections with 5 topics each. Under each topic, you can add up to 10 reports. Note that Collections are displayed in alphabetical order, based on collection name, in the report navigation and the order cannot be changed. If you want the collections in a particular order, add numbers at the beginning of the collection names.
Collection: A set of reports. You can create your own collections. Life cycle and User are predefined collections that appear in the report navigation by default.
Topic: A subset of reports within a collection. For example, Acquisition is a topic within the Life cycle collection. You can create your own topics. A topic contains one overview report and one or more detail reports.Each topic can have up to 10 reports.
Example: Non-eCommerce lead generation website (no app) has the following navigation structure in a GA4 property:
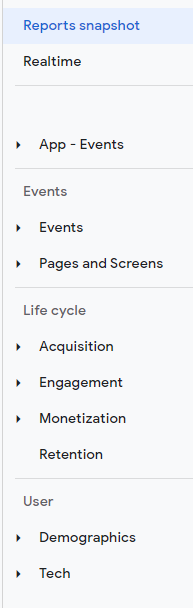
Keep in mind that this site doesn’t have eCommerce and it doesn’t have app traffic. The simplest adjustments you can do is to remove all ‘Monetization’ reports as well as ‘App – Events’ reports. Suddenly, it’s not too scary, and more relevant.
Keep reports that are relevant to your business based on the company’s goals and objectives.
Example: Let’s adjust reports for the same website. As you can see below, the ‘Events’ topic includes ‘Ecommerce purchases’ report which is not needed for this website. Let’s remove it.


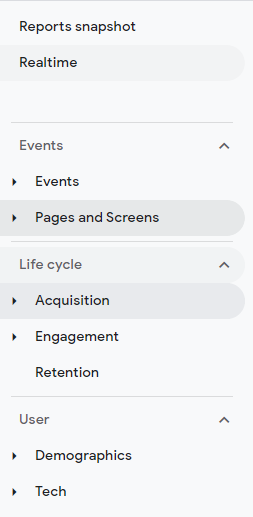
Voila! A less convoluted version is ready in only 20 seconds. Adjust default reports and create your own reports (200 reports limit per GA4 property) to make navigation easier and more suitable for your end-users.
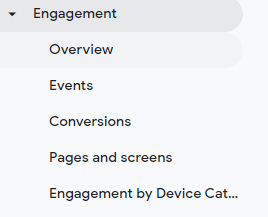
Example: Let’s add a new report that will be a part of the ‘Engagement’ topic that is available by default with three reports:

You can add two types of reports: Overview and Detail Report
Overview report: A dashboard (comprising a set of cards) that summarizes the detail reports in a topic. (A topic can have only one overview report.)
Detail report: Can have up to two visualizations and a table with dimensions and metrics.
Let’s add a report called ‘Engagement by Device Category’ where you can see the number of events, events per user, and events per session broken down by mobile, desktop, and tablet device categories.

There is no way to add the new report to the ‘Engagement’ topic, but there is a work around:
- Make a copy of the default ‘Life cycle’, remove ‘Engagement’ Topic and assemble the topic again, but add the newly created report ‘Engagement by Device Category’.
- After that, unpublish the default collection and publish the new one you created.
The end result looks like this:
This way Google Analytics can be used more widely in the company. You can get creative with the setup and use unconventional breakdowns, for example, creating a collection for each team that is using the GA4 property.
There are templates available that can be repurposed, so the planning and creation don’t start from scratch.
Click ‘Create new collection’ in the Library, and you will be presented with the following templated options (plus ‘create your own collection’).

One of the templates is the default setup, so you can easily start your plan there by reviewing the reports available and adding or removing collections and topics that are not applicable to your business. (For example, remove ‘Monetization’ reports if you are a non-ecommerce business.)
A lot of times there will be new reports available as new features, as new dimensions and metrics become available in GA4, and they are added to default reports. With the ability to link the objects (collection, topic, report) to receive updates from Google, you don’t have to worry that the updates will be missed. On the other hand, if you believe your collection is complete and you don’t want any new reports appearing in the setup, you can choose to unlink the object (collection, topic, report). Note: You cannot link it back if you unlink the object.
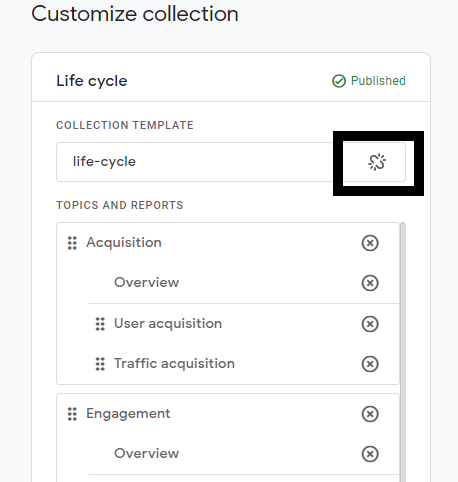
Keep the linking on for now – with GA4’s rapid rollout of new features, you don’t want to miss anything important. It’s better to remove or update that new report if it doesn’t serve the needs of your business. Use the ‘unlink’ icon that is highlighted in the image below.
I hope you will enjoy the planning and customization of the report navigation and your team who uses GA4 will be amazed!